
Technical Analysis

Technical Analysis
Technical analysis is a technique which utilizes patterns of price history of a financial instrument in order to provide indications on the future behavior of prices. Prices are set by supply and demand, fear and greed. Like weather forecasting, technical analysis does not result in absolute predictions about the future. Instead, technical analysis can help investors anticipate what is “likely” to happen to prices over time. Technical analysis uses a wide variety of charts that show price over time. Technical analysts believe that the historical performance of stocks and markets are indications of future performance.
"history does not always repeat itself - but it often rhymes"
Timing is everything! Enrich your skills and become more proficient at technical analysis by learning to recognize different chart patterns and charting techniques and master your skills by acquiring the official CFTe diploma. People who are using technical analysis can create a clear performance advantage over people who don't! Check out this post to see 9 practical examples of technical analysis.
Enter into the fascinating world of technical chart analysis. See firsthand the power behind a real understanding of price action and volume. Then, gain a deep appreciation for the mathematical formulas in the form of indicators and oscillators that have been developed to describe price and volume in a wide variety of ways.
WARNING: social media is full of financial influencers, scammers, and other "wanna-be" experts with zero academic background promising you to get rich quickly. Real life trading is different! If you learn it the professional way, you can get really successful over time. Or you decide to stick to those shady people and learn it the hard way...

Recommended reading: SAMT BLOG
Education is a permanent process - never stop reading. We recommend you to check out our BLOG, where you will find articles related to technical analysis on a regular basis to keep you at the pulse of the market.
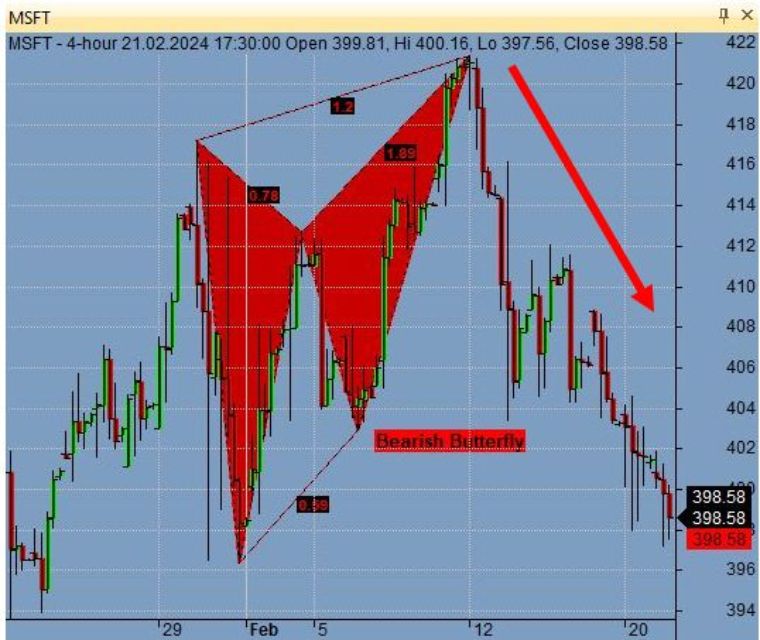
(img.1) A bearish butterfly pattern on Microsoft (MSFT)
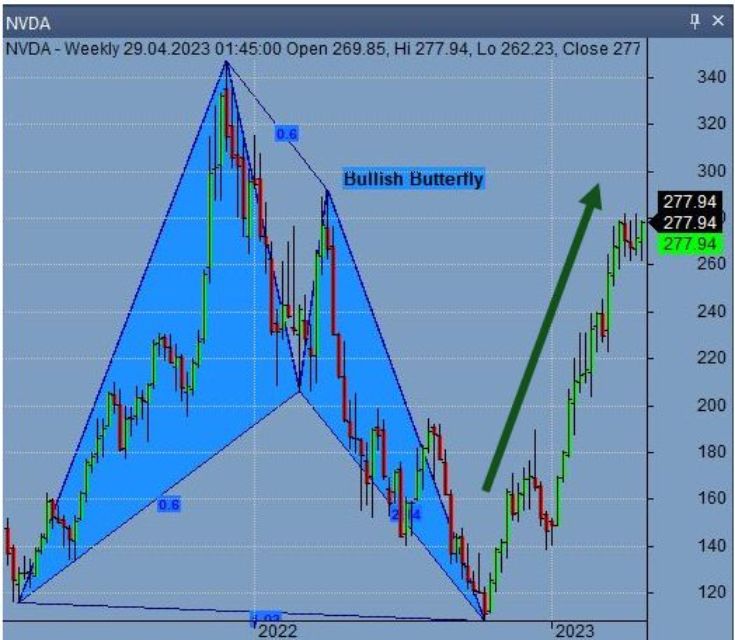
(img.2) A bullish butterfly pattern on Nvidia (NVDA)
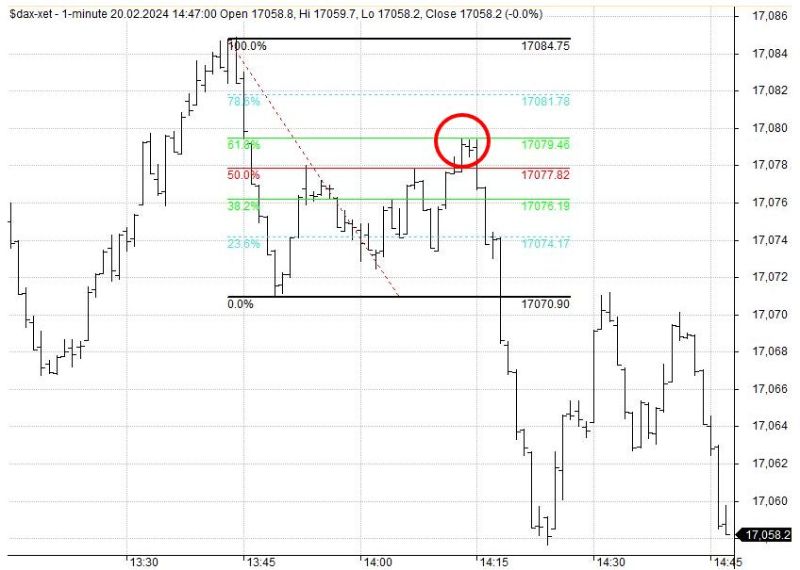
(img.3) German DAX index is retracing perfectly to its 61.8% Fibonacci retracement line
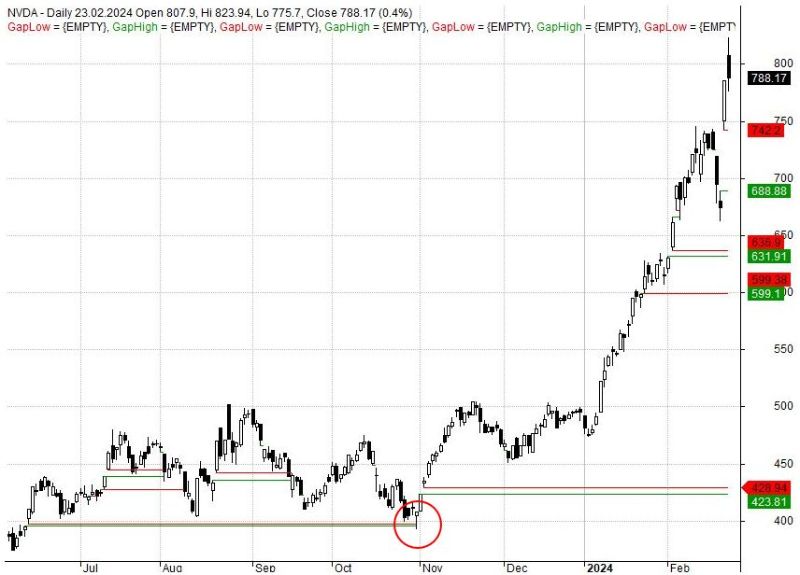
(img.4) Gaps acting as future support and resistance lines like in this example of Nvidia (NVDA)
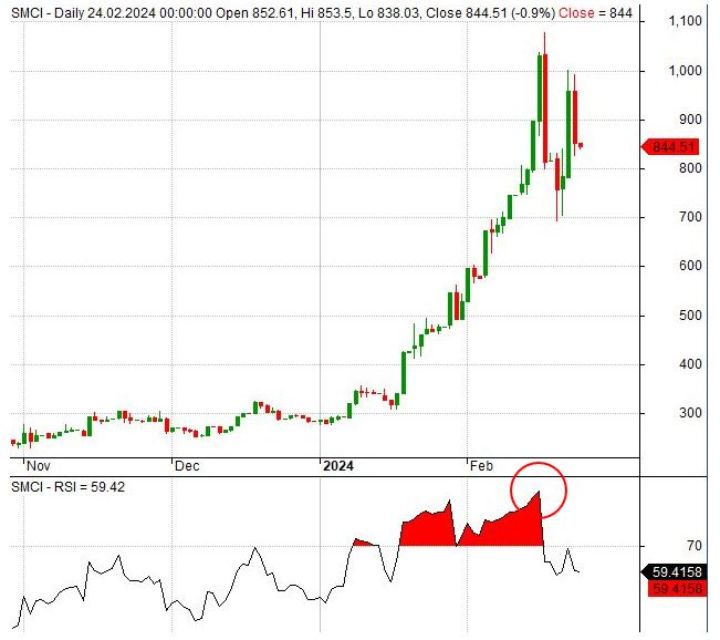
(img.5) Extreme levels on the RSI indicator showing that a trend reversal on Super Micro Computer Inc (SMCI) is imminent
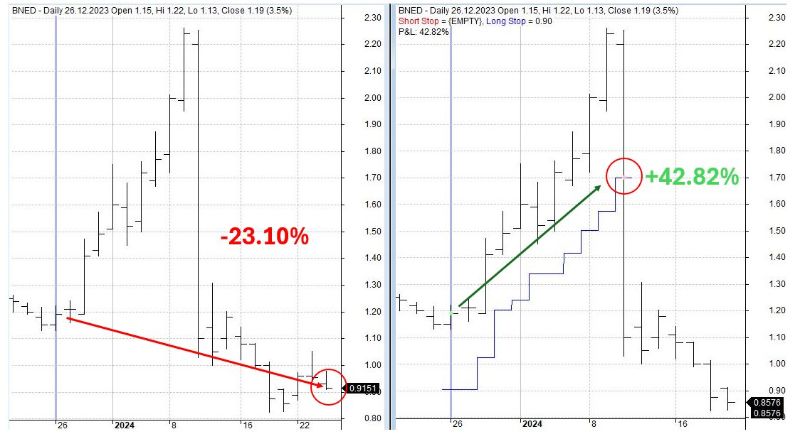
(img.6) no stoploss vs. a trailing stop loss as in this example of Barnes & Noble Education Inc (BNED)
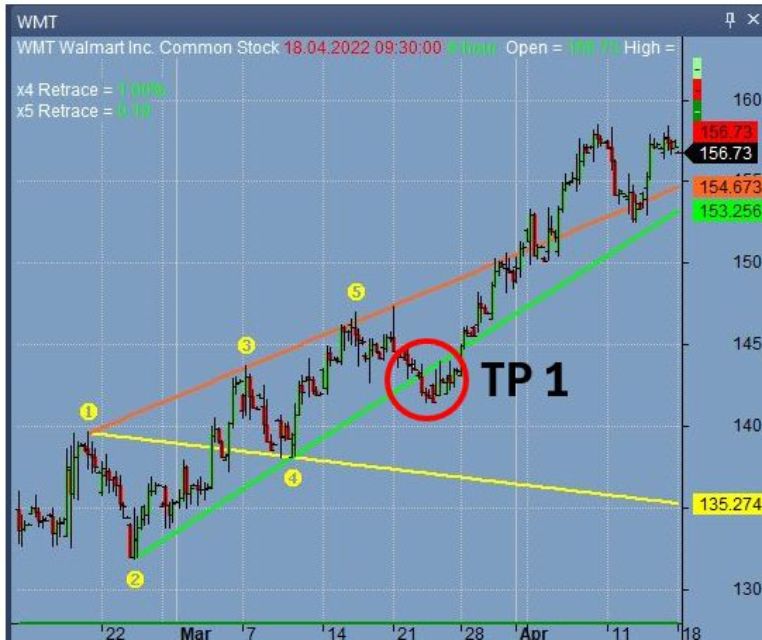
(img.7) A Wolfe Wave pattern as shown in Walmart (WMT) hitting its target 1
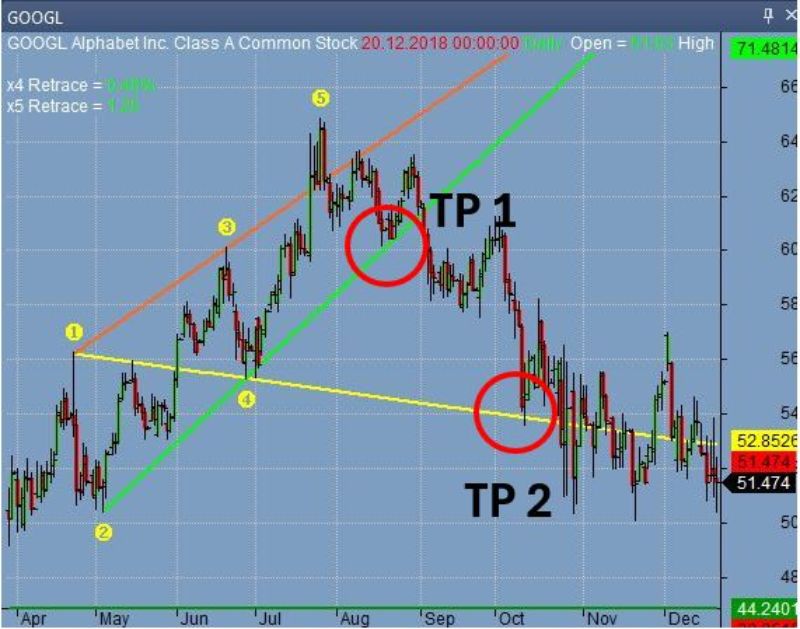
(img.8) A Wolfe Wave pattern as shown in Google (GOOGL) hitting its targets 1 and 2
Want to learn how to analyze stocks like in the examples above? Start your educational journey and become a member now!

Recommended course: SAMT Home Study Course
Learn Technical Analysis at your convenience online - comprehensive material prepared by experts of the industry.
Information videos

Martin Pring on cycles

Robin Griffiths on World Investment Strategy

SAMT on the benefits of Technical Analysis

Hank Pruden on Technical Analysis
Technical Analysis vs. Fundamental Analysis - an academic study
What's better, technical analysis or fundamental analysis? That question is an age-old debate with no sure outcome until a recent study, conducted by Doron Avramov and Haim Levy, finance professors at the Hebrew University of Jerusalem as well as Guy Kaplanksi, a finance professor at Bar-Ilan University, gives technicians a clear win over fundamental analysts.
The focus of their study were a thousand pairs of recommendations made between November 2011 and December 2014 on the TV show “Talking Numbers,” which is jointly broadcast by CNBC and Yahoo. The first half of each pair was a recommendation from a top technician about a stock in the news; the second half was a recommendation about that same stock from a leading fundamental analyst. The performance of those stocks was then measured over time. Summary in a few words: when it comes to forecasting the direction of individual stocks over the next several months, this new study definitely shows that top technicians deserve our attention more than leading analysts.
Thank you Doron Avramov, Haim Levy and Guy Kaplanksi for this great piece of work!

CNBC (English)

NZZ (German)

Meteorology
Everybody relies on the weather forecast - although it is a logical consequence of physical conditions, often influenced by so many factors that even the best meteorological models fail sometimes. But today's models work with high probability of accuracy. Built on indicators such as wind, temperature or air pressure, weather reports model a trend for the foreseable future. The shorter the time interval, the more accurate the report. Just like technical analysis. If you try to build a weather report for a period in 6 month time, it will turn out to have a very low probability of accuracy. Today's weather reports are as accurate, it can tell you the exact weather for the hours, days or weeks to come. Technical analysis works in time frames as well. The shorter the time span in relation to its time frame, the more accurate the analysis.
Comparing Technical and Fundamental Analysis
Fundamental analysis looks at all financial data of a company, aimed at determining the "correct" calue of a stock" and therefore find mispriced securities. While this is a good indicator of the financial health of a company, numbers are published only every 3 month - way not enough if you want to trade on a daily basis. Certain companies, e.g. airlines, publish data such as their monthly load factors, when then can be modeled to a trend or a year-on-year comparison model. Better than quarterly data, still not good enough yet for daily trading. While fundamental analysis is a great tool to identify key points/turning points in the market, technical analysis is a great timing tool. With the right set of indicators, technical analysts often have an indication of the next market move ahead of the crowd.
Fundamental Analysis
"What" and "Why"
Analyze the COMPANY
P / E
what should the market do?
Technical Analysis
"When" and "How"
Analyze the STOCK
P / E
what is the market doing?
Famous Technical Analysis Quotes
There is the plain fool who does the wrong thing at all times anywhere, but there is the Wall Street fool who thinks he must trade all the time.

Jesse Livermore -
American Investor
They are a reflection of the trend in the hopes, fears, knowledge, optimism, and greed of market participants. The sum of total of these emotions is expressed in the price level, which is, as Garfield Drew noted, “never what they (i.e. stocks) are worth, but what people think they are worth.

Martin Pring -
Technical Analysis Explained
The illusion of randomness gradually disappears as the skill in chart reading improves.

John Murphy -
American Financial Market Analyst
The four most dangerous words in investing are: 'this time it's different.

Sir John Templeton -
British investor, fund manager and philanthropist
An investment in knowledge always pays the best interest.

Benjamin Franklin -
Statesman, scientist and inventor
Behavior Analysis, Rational Analysis, Quantitative Analysis and Technical Analysis.
Quantitative Analysis is the analysis of technical and fundamental data. It attempts to create and deliver a mathematically and statistically rigorous decision framework. Quantitative Analysts believe that the numbers are right.
Behavioral Analysis is the study of human factors that impact investment decision making. An important focus is on the systematic errors that investors and traders make over time. Behavioralists believe that people can be wrong.
Rational Analysis is the juncture of the set of technical and fundamental analysis. There is a bit of all of the described approaches in technical analysis. With increased experience over time, you will start to realize the benefits of technical analysis and how to rely on it.